Everything about Bivariate data
Statistical term of data on each of two paired variables
In statistics, bivariate data is data on each of two variables, where each value of one of the variables is paired with a value of the other variable. It is a specific but very common case of multivariate data. The association can be studied via a tabular or graphical display, or via sample statistics which might be used for inference. Typically it would be of interest to investigate the possible association between the two variables. The method used to investigate the association would depend on the level of measurement of the variable. This association that involves exactly two variables can be termed a bivariate correlation, or bivariate association. Wikipedia →
🧭 Start here: a 6-step reading path
- Read the overview: Bivariate dataA 5-minute orientation
- Skim a recent paper: Density-based clustering for bivariate-flow dataInfluential work since 2022
- Pick up a classic book: StatisticsThe most-reprinted book on the subject
- Read the landmark paper: Bivariate Agreement Coefficients for Reliability of DataCited 128 times
- Go sideways: Bivariate analysisA closely related topic
- Go sideways: Scatter plotA closely related topic
📖 Definitions
No dictionary entry for this exact phrase.
🗂️ The subject at a glance
🏆 Landmark papers (most cited)
Bivariate Agreement Coefficients for Reliability of Data
Bivariate Correlation with Spatial Data
Nonparametric bivariate estimation with randomly censored data
Analyzing TREF data by stockmayer's bivariate distribution
Bivariate colour maps for visualizing climate data
Generalized bivariate count data regression models
Some Statistical Methods for Bivariate Circular Data
Adaptive thinning for bivariate scattered data
🆕 Influential since 2022
Density-based clustering for bivariate-flow data
Flow colocation quotient: Measuring bivariate spatial association for flow data
A real‐time monitoring approach for bivariate event data
Data Analysis by Adaptive Progressive Hybrid Censored Under Bivariate Model
Visualizing ordered bivariate data on node-link diagrams
📚 Books worth reading
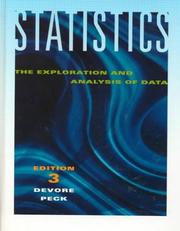 StatisticsJay L. Devore, Roxy Peck · 1985
 Modeling dyadic and interdependent data in the developmental and behavioral sciencesNoel A. Card, Todd D. Little · 2008
 Elementary statisticsWilliam Cyrus Navidi · 2012
- 📕Micros in Mathematical Education (Mime)A. C. Bajpai · 1987
- 📕SPSS Data Analysis for Univariate, Bivariate, and Multivariate StatisticsDaniel J. Denis · 2018
- 📕Univariate, Bivariate, and Multivariate Statistics Using RDaniel J. Denis · 2020
 Applied Univariate, Bivariate, and Multivariate Statistics Using PythonDaniel J. Denis · 2021
 Statistical graphics for univariate and bivariate dataWilliam G. Jacoby · 1997
Ranked by number of editions on Open Library, a rough measure of how lasting a book is.
🔗 Related topics
- Bivariate analysis Bivariate analysis is one of the simplest forms of quantitative (statistical) analysis. It involves the analysis of two variables (often denoted as X, Y)…
- Scatter plot A scatter plot, also called a scatterplot, scatter graph, scatter chart, scattergram, or scatter diagram, is a type of plot or mathematical diagram using…
- Pearson correlation coefficient In statistics, the Pearson correlation coefficient (PCC), also known as Pearson's r, the Pearson product-moment correlation coefficient (PPMCC), or simply…
- Multivariate statistics Multivariate statistics is a subdivision of statistics encompassing the simultaneous observation and analysis of more than one outcome variable, i.e.,…
- Plot (graphics) A plot is a graphical technique for representing a data set, usually as a graph showing the relationship between two or more variables. The plot can be…
- Correlation In statistics, correlation is a type of statistical relationship between two random variables or bivariate data. It usually refers to the extent to which…
- Correlation coefficient A correlation coefficient is a numerical measure of some type of linear correlation, meaning a linear function between two variables. The variables may…
- Simple linear regression In statistics, simple linear regression (SLR) is a linear regression model with a single explanatory variable. That is, it concerns two-dimensional sample…