Live briefing

Everything about Visualization (graphics)
Set of techniques for creating images, diagrams, or animations to communicate a message
Visualization, also known as graphics visualization, is any technique for creating images, diagrams, or animations to communicate a message. Visualization through visual imagery has been an effective way to communicate both abstract and concrete ideas since the dawn of humanity. Examples from history include cave paintings, Egyptian hieroglyphs, Greek geometry, and Leonardo da Vinci's revolutionary methods of technical drawing for engineering purposes that actively involve scientific requirements. Wikipedia →
🧭 Start here: a 6-step reading path
- Read the overview: Visualization (graphics)A 5-minute orientation
- Skim a recent paper: ggkegg : analysis and visualization of KEGG data utilizing the grammar of graphicsInfluential work since 2022
- Pick up a classic book: Sémiologie graphiqueThe most-reprinted book on the subject
- Read the landmark paper: SRplot: A free online platform for data visualization and graphingCited 2,758 times
- Go sideways: Volume renderingA closely related topic
- Go sideways: Scientific visualizationA closely related topic
📖 Definitions
No dictionary entry for this exact phrase.
🗂️ The subject at a glance
🏆 Landmark papers (most cited)
SRplot: A free online platform for data visualization and graphing
OrganellarGenomeDRAW (OGDRAW) version 1.3.1: expanded toolkit for the graphical visualization of organellar genomes
Metaverse: Perspectives from graphics, interactions and visualization
Immersive visualization with bar graphics
Perception, imagery, visualization and engineering graphics
Computer graphics visualization for acoustic simulation
Computer-Based Graphics for Terrain Visualization Training
AGGREGATION OPERATORS VISUALIZATION USING 3D COGNITIVE GRAPHICS
🆕 Influential since 2022
ggkegg : analysis and visualization of KEGG data utilizing the grammar of graphics
Visualization of the complex double-outlet right ventricle anatomy using real-time three-dimensional computer graphics
SES-yolov5: small object graphics detection and visualization applications
Visualization Display System of Gannan Hakka Paper-Cut Works Based on Computer Graphics Algorithm
IEEE Transactions on Visualization and Computer Graphics
📚 Books worth reading
 Sémiologie graphiqueJacques Bertin, Georg Jensch · 1900
 The Visual Display of Quantitative InformationEdward R. Tufte · 1983
 White space is not your enemyKim Golombisky · 2010
 Motion Graphic DesignJon Krasner, Jon S. Krasner · 2008
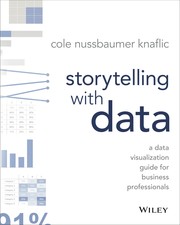 Storytelling with DataCole Nussbaumer Knaflic · 2015
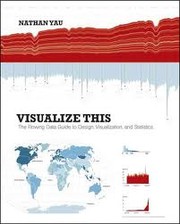 Visualize thisNathan Yau · 2011
 Visual Perception From A Computer Graphics PerspectiveSarah Creem-Regehr · 2011
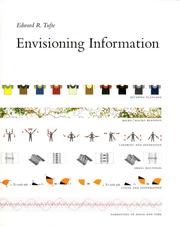 Envisioning InformationEdward R. Tufte · 1990
Ranked by number of editions on Open Library, a rough measure of how lasting a book is.
🔗 Related topics
- Volume rendering In scientific visualization and computer graphics, volume rendering is a set of techniques used to display a 2D projection of a 3D discretely sampled data…
- Scientific visualization Scientific visualization (also spelled scientific visualisation) is an interdisciplinary branch of science concerned with the visualization of scientific…
- Visual computing Visual computing is a generic term for all computer science disciplines dealing with images and 3D models, such as computer graphics, image processing…
- Computer graphics (computer science) Computer graphics is a sub-field of computer science which studies methods for digitally synthesizing and manipulating visual content. Although the term…
- Computer-generated imagery Computer-generated imagery (CGI) is a specific application of computer graphics for creating or improving images in art, printed media, simulators, videos…
- Real-time computer graphics Real-time computer graphics or real-time rendering is the sub-field of computer graphics focused on producing and analyzing images in real time. The term…
- 3D computer graphics 3D computer graphics, sometimes called 3D computer-generated imagery (3D-CGI), refers to computer graphics that use a three-dimensional (3D) representation…
- List of 3D computer graphics software This list of 3D graphics software contains software packages related to the development and exploitation of 3D computer graphics. For a comparison, see…