Everything about Scientific visualization
Interdisciplinary branch of science concerned with presenting scientific data visually

Scientific visualization is an interdisciplinary branch of science concerned with the visualization of scientific phenomena. It is also considered a subset of computer graphics, a branch of computer science. The purpose of scientific visualization is to graphically illustrate scientific data to enable scientists to understand, illustrate, and glean insight from their data. Research into how people read and misread various types of visualizations is helping to determine what types and features of visualizations are most understandable and effective in conveying information. Wikipedia →
🧭 Start here: a 6-step reading path
- Read the overview: Scientific visualizationA 5-minute orientation
- Pick up a classic book: Interactive computer graphicsThe most-reprinted book on the subject
- Go sideways: VisItA closely related topic
- Go sideways: Visualization (graphics)A closely related topic
📖 Definitions
No dictionary entry for this exact phrase.
🗂️ The subject at a glance
🏆 Landmark papers (most cited)
- No matching papers found.
📚 Books worth reading
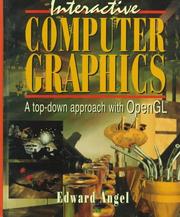 Interactive computer graphicsEdward Angel · 1997
- 📕Visual Representations in ScienceNicola Mößner · 2018
- 📕Three-dimensional visualization of ozone process dataJames Ernest Rickman · 1997
- 📕Visualization of 3-D tensor fieldsLambertus Hesselink · 1996
- 📕Kultur des DiagrammsJohn Bender · 2014
- 📕Physics of boundaries and their interactions in space plasmasNojan Omidi · 1998
- 📕Three-dimensional user interfaces for scientific visualizationAndries Van Dam · 1995
 Science from Sight to InsightAlan G. Gross, Joseph E. Harmon · 2013
Ranked by number of editions on Open Library, a rough measure of how lasting a book is.
🔗 Related topics
- VisIt VisIt is an open-source, interactive parallel visualization, and graphical analysis tool designed for viewing scientific data. It can visualize scalar…
- Visualization (graphics) Visualization (or visualisation in Commonwealth English; see spelling differences), also known as graphics visualization, is any technique for creating…
- Volume rendering In scientific visualization and computer graphics, volume rendering is a set of techniques used to display a 2D projection of a 3D discretely sampled data…
- Computer graphics Computer graphics (CG) deals with generating images and art with the aid of computers. Computer graphics is a core technology in digital photography, film…
- 3D computer graphics 3D computer graphics, sometimes called 3D computer-generated imagery (3D-CGI), refers to computer graphics that use a three-dimensional (3D) representation…
- Computer graphics (computer science) Computer graphics is a sub-field of computer science which studies methods for digitally synthesizing and manipulating visual content. Although the term…
- Voreen Voreen (volume rendering engine) is an open-source volume visualization library and development platform. Through the use of GPU-based volume rendering…
- MeVisLab MeVisLab is a cross-platform application framework for medical image processing and scientific visualization. It includes advanced algorithms for image…