Live briefing

Everything about Statistical graphics
Images used to represent statistical data visually
Statistical graphics, also known as statistical graphical techniques, are graphics used in the field of statistics for data visualization. Wikipedia →
🧭 Start here: a 6-step reading path
- Read the overview: Statistical graphicsA 5-minute orientation
- Skim a recent paper: A General Approach to Visualizing Uncertainty in Statistical GraphicsInfluential work since 2022
- Pick up a classic book: Elementary StatisticsThe most-reprinted book on the subject
- Read the landmark paper: Animated Transitions in Statistical Data GraphicsCited 356 times
- Go sideways: InfographicA closely related topic
- Go sideways: Edward TufteA closely related topic
📖 Definitions
No dictionary entry for this exact phrase.
🏆 Landmark papers (most cited)
Animated Transitions in Statistical Data Graphics
Escaping RGBland: Selecting colors for statistical graphics
The Golden Age of Statistical Graphics
Statistical Graphics: Mapping the Pathways of Science
Infovis and Statistical Graphics: Different Goals, Different Looks
Using Graphics and Simulation to Teach Statistical Concepts
Research in Statistical Graphics
Statistical Graphics in Pharmacokinetics and Pharmacodynamics: A Tutorial
🆕 Influential since 2022
A General Approach to Visualizing Uncertainty in Statistical Graphics
Eye-Tracking in Statistical Graphics Research: A Scoping Review
Clusters, Trends, and Choices: Feature Selection in Interactive Statistical Graphics
Advancing SDG5: Machine Learning and Statistical Graphics for Women’s Empowerment and Gender Equity
The Flawed Genius of William Playfair: The Story of the Father of Statistical Graphics
📚 Books worth reading
 Elementary StatisticsRon Larson · 1999
 Sémiologie graphiqueJacques Bertin, Georg Jensch · 1900
 StatsRichard D. De Veaux, Paul F. Velleman · 2007
 The Visual Display of Quantitative InformationEdward R. Tufte · 1983
 Introduction to probability modelsSheldon M. Ross · 1972
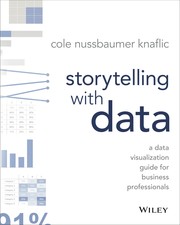 Storytelling with DataCole Nussbaumer Knaflic · 2015
 StatsRichard D. De Veaux, Paul F. Velleman · 2007
 Graphs & digraphsGary Chartrand, L. Lesniak · 1986
Ranked by number of editions on Open Library, a rough measure of how lasting a book is.
🔗 Related topics
- Infographic Infographics (a clipped compound of "information" and "graphics") are graphic visual representations of information, data, or knowledge intended to present…
- Edward Tufte Edward Rolf Tufte (/ˈtʌfti/ ; born March 14, 1942), sometimes known as "ET", is an American statistician and professor emeritus of political science, statistics…
- Information design Information design is the practice of presenting information in a way that fosters an efficient and effective understanding of the information. The term…
- Motion chart A motion chart is a dynamic bubble chart which allows efficient and interactive exploration and visualization of longitudinal multivariate data. Motion…
- Pie chart A pie chart (or a circle chart) is a circular statistical graphic which is divided into slices to illustrate numerical proportion. In a pie chart, the…
- Data and information visualization Data and information visualization (data viz/vis or info viz/vis) is the practice of designing and creating graphic or visual representations of quantitative…
- Graphical perception Graphical perception is the human capacity for visually interpreting information on graphs and charts. Both quantitative and qualitative information can…
- Chartjunk Chartjunk consists of all visual elements in charts and graphs that are not necessary to comprehend the information represented on the graph, or that distract…