Everything about Data and information visualization
Visual representation of data

Data and information visualization is the practice of designing and creating graphic or visual representations of quantitative and qualitative data and information with the help of static, dynamic or interactive visual items. These visualizations are intended to help a target audience visually explore and discover, quickly understand, interpret and gain important insights into otherwise difficult-to-identify structures, relationships, correlations, local and global patterns, trends, variations, constancy, clusters, outliers and unusual groupings within data. When intended for the public to convey a concise version of information in an engaging manner, it is typically called infographics. Wikipedia →
🧭 Start here: a 6-step reading path
- Read the overview: Data and information visualizationA 5-minute orientation
- Skim a recent paper: Smart Home Energy Visualizer: A Fusion of Data Analytics and Information VisualizationInfluential work since 2022
- Pick up a classic book: Cooperative Design, Visualization, and EngineeringThe most-reprinted book on the subject
- Read the landmark paper: Information visualization and visual data miningCited 1,039 times
- Go sideways: Statistical graphicsA closely related topic
- Go sideways: InfographicA closely related topic
📖 Definitions
No dictionary entry for this exact phrase.
🏆 Landmark papers (most cited)
Information visualization and visual data mining
Data, Information, and Knowledge in Visualization
Data Flow Analysis and Visualization for Spatiotemporal Statistical Data without Trajectory Information
A Conspiracy of Data: QAnon, Social Media, and Information Visualization
Analysis and Visualization of Seismic Data Using Mutual Information
Text, Image, Data, Interaction: Understanding Information Visualization
Multivariate Pointwise Information-Driven Data Sampling and Visualization
Data Visualization and Information Literacy
🆕 Influential since 2022
Smart Home Energy Visualizer: A Fusion of Data Analytics and Information Visualization
Multidimensional data visualization and synchronization for revealing hidden pandemic information
Information Visualization Based on Visual Transmission and Multimedia Data Fusion
Data Visualization Design: Strategies for Optimizing Information Delivery and Decision Support
Information technologies for visualization and data processing in the sphere of geospatial intelligence
📚 Books worth reading
 Cooperative Design, Visualization, and EngineeringYuhua Luo · 2004
 Advances in visual computingGeorge Bebis, Richard Boyle · 2005
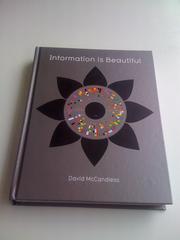 Information is BeautifulDavid McCandless · 2010
 Advances in Visual ComputingGeorge Bebis · 2012
 Mapping Scientific FrontiersChaomei Chen · 2003
 Visualization In The Age Of ComputerizationAnnamaria Carusi · 2013
 Visual Analytics for ManagementElliot Bendoly, Sacha Clark · 2016
 Visualizing the semantic WebChaomei Chen, Vladimir Geroimenko · 2003
Ranked by number of editions on Open Library, a rough measure of how lasting a book is.
🔗 Related topics
- Statistical graphics Statistical graphics, also known as statistical graphical techniques, are graphics used in the field of statistics for data visualization. Whereas statistics…
- Infographic Infographics (a clipped compound of "information" and "graphics") are graphic visual representations of information, data, or knowledge intended to present…
- Motion chart A motion chart is a dynamic bubble chart which allows efficient and interactive exploration and visualization of longitudinal multivariate data. Motion…
- Information design Information design is the practice of presenting information in a way that fosters an efficient and effective understanding of the information. The term…
- Chernoff face Chernoff faces are a data visualization method invented by applied mathematician, statistician, and physicist Herman Chernoff in 1973. It displays a set…
- Visualization (graphics) Visualization (or visualisation in Commonwealth English; see spelling differences), also known as graphics visualization, is any technique for creating…
- Chartjunk Chartjunk consists of all visual elements in charts and graphs that are not necessary to comprehend the information represented on the graph, or that distract…
- Plot (graphics) A plot is a graphical technique for representing a data set, usually as a graph showing the relationship between two or more variables. The plot can be…