Everything about Probit
Statistical function that converts a probability to a standard normal score

In statistics, the probit function converts a probability into a score. This score indicates how many standard deviations a value from a standard normal distribution is from the mean. For example, a probability of 0.5 (50%) represents the exact middle of the distribution, so its probit score is 0. A smaller probability like 0.025 (2.5%) is far to the left on the curve, corresponding to a probit score of approximately −1.96. Wikipedia →
🧭 Start here: a 6-step reading path
- Read the overview: ProbitA 5-minute orientation
- Skim a recent paper: Crash injury severity analysis of E-Bike Riders: A random parameters generalized ordered probit model with heterogeneity in meansInfluential work since 2022
- Pick up a classic book: Probit analysisThe most-reprinted book on the subject
- Read the landmark paper: Interaction terms in logit and probit modelsCited 4,605 times
- Go sideways: LogitA closely related topic
- Go sideways: Probit modelA closely related topic
📖 Definitions
Noun A unit, derived from a standard normal distribution, used in measuring the responses to doses.
Noun The probit function, the inverse of the standard normal cumulative distribution function.
🗂️ The subject at a glance
🏆 Landmark papers (most cited)
Interaction terms in logit and probit models
Computing Interaction Effects and Standard Errors in Logit and Probit Models
The use of logit and probit models in strategic management research: Critical issues
Comparing Regression Coefficients Between Same-sample Nested Models Using Logit and Probit
Promotion of Breastfeeding Intervention Trial (PROBIT)
Limited information estimators and exogeneity tests for simultaneous probit models
An extension of the Blinder-Oaxaca decomposition technique to logit and probit models
Comparing Logit and Probit Coefficients Across Groups
🆕 Influential since 2022
Crash injury severity analysis of E-Bike Riders: A random parameters generalized ordered probit model with heterogeneity in means
Comparative analysis of pedestrian crash severity at United Kingdom rural road intersections and Non-Intersections using latent class clustering and ordered probit model
Comparing logit & probit coefficients between nested models
Analysis of the injury-severity outcomes of maritime accidents using a zero-inflated ordered probit model
Driving policy support for open eco-innovation enterprises in Thailand: A probit regression model
📚 Books worth reading
 Probit analysisD. J. Finney · 1947
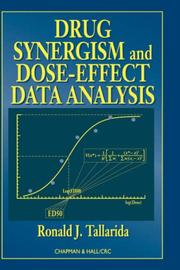 Drug Synergism and Dose-Effect Data AnalysisRonald J. Tallarida · 2000
- 📕Simultane Probit- und TobitmodelleWinfried Pohlmeier · 1989
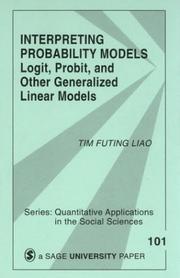 Interpreting probability modelsTim Futing Liao · 1994
 Multinomial probitCarlos Daganzo · 1979
 An introduction to the interpretation of quantal responses in biologyPaul Soames Hewlett · 1979
- 📕Estimation and inference in bivariate and multivariate ordinal probit modelsGeorgina Bermann · 1993
- 📕Graduating to globalisationDilek Demirbas · 2010
Ranked by number of editions on Open Library, a rough measure of how lasting a book is.
🔗 Related topics
- Logit In statistics, the logit (logistic unit) or log-odds function is the quantile function associated with the standard logistic distribution. It has many…
- Probit model In statistics, a probit model is a type of regression where the dependent variable can take only two values. The word is a portmanteau, coming from probability…
- Logistic distribution In probability theory and statistics, the logistic distribution is a continuous probability distribution. Its cumulative distribution function is the logistic…
- Ordinal regression In statistics, ordinal regression, also called ordinal classification, is a type of regression analysis used for predicting an ordinal variable, i.e. a…
- Mills ratio In probability theory, the Mills ratio (or Mills's ratio) of a continuous random variable X is the function m(x):=F¯(x)f(x), where f(x) is the probability…
- Quantile function In probability and statistics, the quantile function of a probability distribution is the inverse of its cumulative distribution function. That is, the…
- Binomial regression In statistics, binomial regression is a regression analysis technique in which the response (often referred to as Y) has a binomial distribution: it is…
- Binary regression In statistics, specifically regression analysis, a binary regression estimates a relationship between one or more explanatory variables and a single output…