Live briefing
Everything about Pooled variance
Method for estimating variance of several different populations
In statistics, pooled variance is a method for estimating variance of several different populations when the mean of each population may be different, but one may assume that the variance of each population is the same. The numerical estimate resulting from the use of this method is also called the pooled variance. Wikipedia →
🧭 Start here: a 6-step reading path
- Read the overview: Pooled varianceA 5-minute orientation
- Skim a recent paper: RAPID: Robust multi-pAtch masker using channel-wise Pooled varIance with two-stage patch DetectionInfluential work since 2022
- Pick up a classic book: Introduction to Probability and StatisticsThe most-reprinted book on the subject
- Read the landmark paper: Using pooled data to estimate variance components and breeding values for traits affected by social interactionsCited 23 times
- Go sideways: VarianceA closely related topic
- Go sideways: Standard deviationA closely related topic
📖 Definitions
No dictionary entry for this exact phrase.
🗂️ The subject at a glance
🏆 Landmark papers (most cited)
Using pooled data to estimate variance components and breeding values for traits affected by social interactions
Why do we use pooled variance analysis of variance?
Estimation of variance components and prediction of breeding values using pooled data1
The Effect of Pooled and Un-Pooled Variance Estimators on CpmWhen Using Subsamples
Heteroskedasticity Robust Panel Unit Root Testing Under Variance Breaks in Pooled Regressions
Constructing control charts for autocorrelated data using an exhaustive systematic samples pooled variance estimator
Pooled error variance and covariance estimation of sparse in situ soil moisture sensor measurements in agricultural fields in Flanders
A more efficient three-arm non-inferiority test based on pooled estimators of the homogeneous variance
🆕 Influential since 2022
📚 Books worth reading
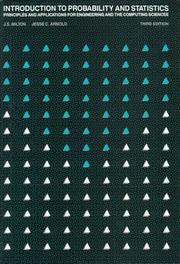 Introduction to Probability and StatisticsJ. Susan Milton, Jesse C. Arnold · 1990
 Numbers rule your worldKaiser Fung · 2010
- 📕Analysis of varianceHelen Bozivich · 1956
 Estimation of variance components and applicationsRao, C. Radhakrishna · 1988
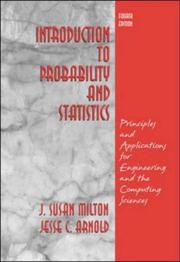 Introduction to probability and statisticsJ. Susan Milton, Jesse C. Arnold · 2002
 Batch effects and noise in microarray experiments, sources, and solutionsAndreas Scherer · 2009
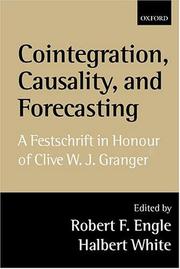 Cointegration, causality, and forecastingR. F. Engle, Halbert White · 1999
 Energy production and services in FinlandPhilip M. Parker · 2007
Ranked by number of editions on Open Library, a rough measure of how lasting a book is.
🔗 Related topics
- Variance In probability theory and statistics, variance is a measure of dispersion, meaning it is a measure of how far a set of numbers are spread out from their…
- Standard deviation In statistics, the standard deviation is a measure of the amount of variation of the values of a variable about its (arithmetic) average. A low standard…
- Normal distribution In probability theory and statistics, a normal distribution or Gaussian distribution is a type of continuous probability distribution for a real-valued…
- Folded normal distribution The folded normal distribution is a probability distribution related to the normal distribution. Given a normally distributed random variable X with mean…
- Chebyshev's inequality In probability theory, Chebyshev's inequality (also called the Bienaymé–Chebyshev inequality) provides an upper bound on the probability of deviation of…
- Student's t-test Student's t-test is a statistical test used to test whether the difference between the response of two groups is statistically significant or not. It is…
- Weighted arithmetic mean The weighted arithmetic mean is similar to an ordinary arithmetic mean (the most common type of average), except that instead of each of the data points…
- Prediction interval In statistical inference, specifically predictive inference, a prediction interval is an estimate of an interval in which a future observation will fall…