Live briefing

Everything about ParaView
Scientific visualization software
ParaView is an open-source multiple-platform application for interactive, scientific visualization. It has a client–server architecture to facilitate remote visualization of datasets, and generates level of detail (LOD) models to maintain interactive frame rates for large datasets. It is an application built on top of the Visualization Toolkit (VTK) libraries. ParaView is an application designed for data parallelism on shared-memory or distributed-memory multicomputers and clusters. It can also be run as a single-computer application. Wikipedia →
🧭 Start here: a 6-step reading path
- Read the overview: ParaViewA 5-minute orientation
- Skim a recent paper: Parallel visualization of reservoir models with ParaViewInfluential work since 2022
- Pick up a classic book: Mysterious AmericaThe most-reprinted book on the subject
- Read the landmark paper: ParaView visualization of Abaqus output on the mechanical deformation of complex microstructuresCited 49 times
- Go sideways: VTKA closely related topic
- Go sideways: VisItA closely related topic
📖 Definitions
No dictionary entry for this exact phrase.
🗂️ The subject at a glance
🏆 Landmark papers (most cited)
ParaView visualization of Abaqus output on the mechanical deformation of complex microstructures
ANALYZING AND VISUALIZING COSMOLOGICAL SIMULATIONS WITH ParaView
In situ visualization of large-scale turbulence simulations in Nek5000 with ParaView Catalyst
Facet Analyser: ParaView plugin for automated facet detection and measurement of interplanar angles of tomographic objects
Visualizing Abaqus output database in ParaView: A universal converter in Python and C++
PVGeo: an open-source Python package for geoscientific visualization in VTK and ParaView
Scientific Visualisation of Atmospheric Data with ParaView
ParaView + Alya + D8tree: Integrating High Performance Computing and High Performance Data Analytics
🆕 Influential since 2022
📚 Books worth reading
 Mysterious AmericaLoren Coleman · 1983
 Astrology and the Art of HealingA. T. Mann · 1989
 Hair of the AlienBill Chalker · 2005
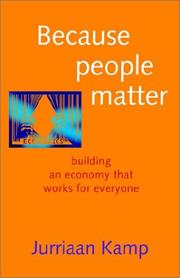 Because people matterJurriaan Kamp · 2002
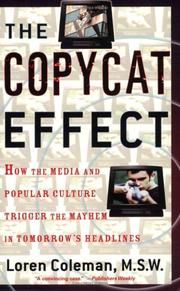 The Copycat EffectLoren Coleman, Loren Coleman · 2004
 The Encyclopedia of Magickal IngredientsLexa Rosean · 2005
 The prankster & the conspiracyAdam Gorightly · 2003
 Bigfoot!Loren Coleman · 2003
Ranked by number of editions on Open Library, a rough measure of how lasting a book is.
🔗 Related topics
- VTK The Visualization Toolkit (VTK) is a free software system for 3D computer graphics, image processing and scientific visualization. VTK is distributed under…
- VisIt VisIt is an open-source, interactive parallel visualization, and graphical analysis tool designed for viewing scientific data. It can visualize scalar…
- Scientific visualization Scientific visualization (also spelled scientific visualisation) is an interdisciplinary branch of science concerned with the visualization of scientific…
- Volume rendering In scientific visualization and computer graphics, volume rendering is a set of techniques used to display a 2D projection of a 3D discretely sampled data…
- MayaVi Free and open-source software portal MayaVi is a scientific data visualizer written in Python, which uses VTK and provides a GUI via Tkinter. MayaVi was…
- 3D Slicer 3D Slicer (Slicer) is a free and open source software package for image analysis and scientific visualization. Slicer is used in a variety of medical applicatio…
- Point Cloud Library The Point Cloud Library (PCL) is an open-source library of algorithms for point cloud processing tasks and 3D geometry processing, such as occur in three-dimens…
- Insight Segmentation and Registration Toolkit ITK is a cross-platform, open-source application development framework widely used for the development of image segmentation and image registration programs…