Everything about Outlier
Observation far apart from others in statistics and data science

In statistics, an outlier is a data point that differs significantly from other observations. An outlier may be due to a variability in the measurement, an indication of novel data, or it may be the result of experimental error; the latter are sometimes excluded from the data set. An outlier can be an indication of exciting possibility, but can also cause serious problems in statistical analyses. Wikipedia →
🧭 Start here: a 6-step reading path
- Read the overview: OutlierA 5-minute orientation
- Skim a recent paper: ECOD: Unsupervised Outlier Detection Using Empirical Cumulative Distribution FunctionsInfluential work since 2022
- Pick up a classic book: Outlier AnalysisThe most-reprinted book on the subject
- Read the landmark paper: Model-based analysis of oligonucleotide arrays: Expression index computation and outlier detectionCited 3,746 times
- Go sideways: Robust statisticsA closely related topic
- Go sideways: Peirce's criterionA closely related topic
📖 Definitions
Noun A person or thing situated away from the main body or outside its proper place.
Noun An exception.
Noun A part of a formation separated from the rest of the formation by erosion.
Noun A value in a statistical sample which does not fit a pattern that describes most other data points; specifically, a value that lies 1.5 IQR beyond the upper or lower quartile.
🗂️ The subject at a glance
🏆 Landmark papers (most cited)
Model-based analysis of oligonucleotide arrays: Expression index computation and outlier detection
Outlier and influence diagnostics for meta-analysis
A Survey of Outlier Detection Methodologies
Percentage Points for a Generalized ESD Many-Outlier Procedure
Universal outlier detection for PIV data
Fine-Tuning Some Resistant Rules for Outlier Labeling
Outlier Treatment in Data Merging
LOSITAN: A workbench to detect molecular adaptation based on a F st -outlier method
🆕 Influential since 2022
ECOD: Unsupervised Outlier Detection Using Empirical Cumulative Distribution Functions
Line-by-line Velocity Measurements: an Outlier-resistant Method for Precision Velocimetry
Skin-Net: a novel deep residual network for skin lesions classification using multilevel feature extraction and cross-channel correlation with detection of outlier
LUNAR: Unifying Local Outlier Detection Methods via Graph Neural Networks
Outlier detection using iterative adaptive mini-minimum spanning tree generation with applications on medical data
📚 Books worth reading
 Outlier AnalysisCharu C. Aggarwal · 2013
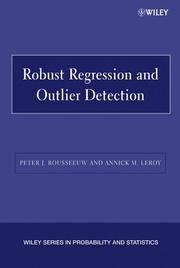 Robust Regression and Outlier DetectionPeter J. Rousseeuw, Annick M. Leroy · 2003
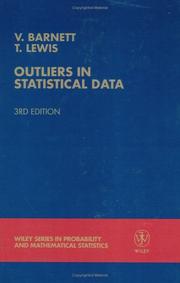 Outliers in statistical dataVic Barnett · 1978
 Outlier Detection for Temporal DataManish Gupta, Jing Gao · 2014
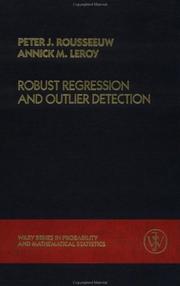 Robust regression and outlier detectionPeter J. Rousseeuw · 1987
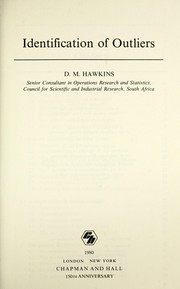 Identification of outliersDouglas M. Hawkins · 1980
- 📕Spuriosity and outliers in circular dataIrwin Guttman · 1988
- 📕Outliers in statistical dataVic Barnett · 1984
Ranked by number of editions on Open Library, a rough measure of how lasting a book is.
🔗 Related topics
- Robust statistics Robust statistics are statistics that maintain their properties even if the underlying distributional assumptions are incorrect. Robust statistical methods…
- Peirce's criterion In robust statistics, Peirce's criterion is a rule for eliminating outliers from data sets, which was devised by Benjamin Peirce. In data sets containing…
- Chauvenet's criterion In statistical theory, Chauvenet's criterion (named for William Chauvenet) is a means of assessing whether one piece of experimental data from a set of…
- Robust measures of scale In statistics, robust measures of scale are methods which quantify the statistical dispersion in a sample of numerical data while resisting outliers. These…
- Errors and residuals In statistics and optimization, errors and residuals are two closely related and easily confused measures of the deviation of an observed value of an element…
- Grubbs's test In statistics, Grubbs's test or the Grubbs test (named after Frank E. Grubbs, who published the test in 1950), also known as the maximum normalized residual…
- Deviation (statistics) In mathematics and statistics, deviation serves as a measure to quantify the disparity between an observed value of a variable and another designated value…
- Contour boxplot In statistical graphics and scientific visualization, the contour boxplot is an exploratory tool that has been proposed for visualizing ensembles of feature-set…