Live briefing

Everything about Ggplot2
Data visualization package for R
ggplot2 is an open-source data visualization package for the statistical programming language R. Created by Hadley Wickham in 2005, ggplot2 is an implementation of Leland Wilkinson's Grammar of Graphics—a general scheme for data visualization which breaks up graphs into semantic components such as scales and layers. ggplot2 can serve as a replacement for the base graphics in R and contains a number of defaults for web and print display of common scales. Since 2005, ggplot2 has grown in use to become one of the most popular R packages. Wikipedia →
🧭 Start here: a 6-step reading path
- Read the overview: Ggplot2A 5-minute orientation
- Skim a recent paper: plotnineSeqSuite: a Python package for visualizing sequence data using ggplot2 styleInfluential work since 2022
- Pick up a classic book: R Graphics CookbookThe most-reprinted book on the subject
- Read the landmark paper: ggplot2Cited 4,422 times
- Go sideways: Wilkinson's Grammar of GraphicsA closely related topic
- Go sideways: Hadley WickhamA closely related topic
📖 Definitions
No dictionary entry for this exact phrase.
🗂️ The subject at a glance
🏆 Landmark papers (most cited)
ggplot2
ggmap: Spatial Visualization with ggplot2
ggplot2: Elegant Graphics for Data Analysis
ggplot2: Elegant Graphics for Data Analysis (2nd ed.)
Application of ggplot2 to Pharmacometric Graphics
ggtranscript : an R package for the visualization and interpretation of transcript isoforms using ggplot2
ggplot2: Elegant Graphics for Data Analysis by WICKHAM, H.
ggtern : Ternary Diagrams Using ggplot2
🆕 Influential since 2022
plotnineSeqSuite: a Python package for visualizing sequence data using ggplot2 style
tidypaleo: Visualizing Paleoenvironmental Archives Using ggplot2
CirclizePlus: using ggplot2 feature to write readable R code for circular visualization
Generalized Mosaic Plots in the \pkg{ggplot2} Framework
ggpedigree: Visualizing Pedigrees with ‘ggplot2’ and ‘plotly’
📚 Books worth reading
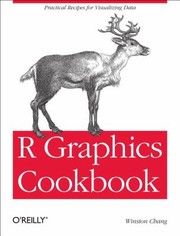 R Graphics CookbookWinston Chang · 2012
 ggplot2Hadley Wickham · 2016
- 📕Ggplot2 EssentialsDonato Teutonico · 2015
- 📕Ggplot2Alboukadel Kassambara · 2015
 Ggplot2Hadley Wickham · 2009
 GGPlot2 EssentialsAlboukadel Kassambara · 2019
 Learn ggplot2 Using Shiny AppKeon-Woong Moon · 2017
- 📕Visualizing Biological Data with Ggplot2William G. Vilchez · 2026
Ranked by number of editions on Open Library, a rough measure of how lasting a book is.
🔗 Related topics
- Wilkinson's Grammar of Graphics The Grammar of Graphics (GoG) is a grammar-based system for representing graphics to provide grammatical constraints on the composition of data and information…
- Hadley Wickham Hadley Alexander Wickham (born 14 October 1979) is a New Zealand statistician known for his work on open-source software for the R statistical programming…
- Leland Wilkinson Leland Wilkinson (November 5, 1944 – December 10, 2021) was an American statistician and computer scientist at H2O.ai and adjunct professor of computer…
- Vega and Vega-Lite visualisation grammars Free and open-source software portal Vega and Vega-Lite are visualization tools implementing a grammar of graphics, similar to ggplot2. The Vega and Vega-Lite…
- Tidyverse Free software portal The tidyverse is a collection of open source packages for the R programming language introduced by Hadley Wickham and his team that…
- GGobi GGobi is a free statistical software tool for interactive data visualization. GGobi allows extensive exploration of the data with Interactive dynamic graphics…
- Exploratory data analysis In statistics, exploratory data analysis (EDA) or exploratory analytics is an approach of analyzing data sets to summarize their main characteristics,…
- R (programming language) R is a programming language for statistical computing and data visualization. It has been widely adopted in the fields of data mining, bioinformatics,…