Live briefing
Everything about GGobi
Statistical software package
GGobi is a free statistical software tool for interactive data visualization. GGobi allows extensive exploration of the data with Interactive dynamic graphics. It is also a tool for looking at multivariate data. R can be used in sync with GGobi. The GGobi software can be embedded as a library in other programs and program packages using an application programming interface (API) or as an add-on to existing languages and scripting environments, e.g., with the R command line or from a Perl or Python scripts. GGobi prides itself on its ability to link multiple graphs together. Wikipedia →
🧭 Start here: a 6-step reading path
- Read the overview: GGobiA 5-minute orientation
- Pick up a classic book: Interactive and Dynamic Graphics for Data AnalysisThe most-reprinted book on the subject
- Read the landmark paper: GGobi: evolving from XGobi into an extensible framework for interactive data visualizationCited 132 times
- Go sideways: Exploratory data analysisA closely related topic
- Go sideways: Dianne Cook (statistician)A closely related topic
📖 Definitions
No dictionary entry for this exact phrase.
🗂️ The subject at a glance
🏆 Landmark papers (most cited)
GGobi: evolving from XGobi into an extensible framework for interactive data visualization
Extending the GGobi pipeline from R
Interactive and Dynamic Graphics for Data Analysis: With R and GGobi by COOK, D. and SWAYNE, D.
Interactive and Dynamic Graphics for Data Analysis: WithRandGGobi
Interactive and Dynamic Graphics for Data Analysis – With R and GGobi by Dianne Cook, Deborah F. Swayne
Book review: Cook D, Swayne DF 2007: Interactive and dynamic graphics for data analysis, With R and GGobi. New York: Springer. 190 pp. $59.95 (PB). ISBN: 978-0-387-71761-6
📚 Books worth reading
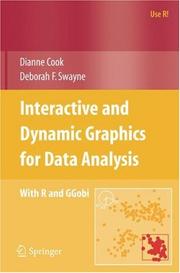 Interactive and Dynamic Graphics for Data AnalysisDianne Cook · 2007
 Interactive and Dynamic Graphics for Data Analysis: With R and Ggobi (Use R!)Dianne Cook, Deborah F. Swayne · 2007
Ranked by number of editions on Open Library, a rough measure of how lasting a book is.
🔗 Related topics
- Exploratory data analysis In statistics, exploratory data analysis (EDA) or exploratory analytics is an approach of analyzing data sets to summarize their main characteristics,…
- Dianne Cook (statistician) Dianne Helen Cook is an Australian statistician, the former editor of the Journal of Computational and Graphical Statistics, and an expert on the visualization…
- Heike Hofmann Heike Hofmann (born 16 April 1972) is a statistician and Professor in the Department of Statistics at University of Nebraska–Lincoln and was previously…
- Data and information visualization Data and information visualization (data viz/vis or info viz/vis) is the practice of designing and creating graphic or visual representations of quantitative…
- Interactive visual analysis Interactive visual analysis (IVA) is a set of techniques for combining the computational power of computers with the perceptive and cognitive capabilities…
- Andreas Buja Andreas Buja is a Swiss statistician and professor of statistics. He is the Liem Sioe Liong/First Pacific Company professor in the Statistics department…
- Mondrian (software) Mondrian is a general-purpose statistical data-visualization system, for interactive data visualization. All plots in Mondrian are fully linked, and offer…
- List of numerical-analysis software Listed here are notable end-user computer applications intended for use with numerical or data analysis: Analytica is a widely used proprietary software…