Live briefing

Everything about Smith chart
Graphical calculator used in electrical engineering
The Smith chart is a circular nomogram used in radio frequency (RF) engineering to solve transmission line and impedance-matching problems. It plots a complex reflection coefficient on a grid of normalized electrical impedance. Depending on the region, it is also known as the Smith diagram, Volpert–Smith chart, or Mizuhashi chart. Wikipedia →
🧭 Start here: a 6-step reading path
- Read the overview: Smith chartA 5-minute orientation
- Skim a recent paper: Smith chart analysis for transmission line method validation of a simple graphene-based absorber in sugar molecules detectionInfluential work since 2022
- Pick up a classic book: Electronic applications of the Smith ChartThe most-reprinted book on the subject
- Read the landmark paper: Fractional Smith Chart TheoryCited 73 times
- Go sideways: Transmission lineA closely related topic
- Go sideways: Reflection coefficientA closely related topic
📖 Definitions
No dictionary entry for this exact phrase.
🗂️ The subject at a glance
🏆 Landmark papers (most cited)
Fractional Smith Chart Theory
Smith chart formulation of performance characterisation for a microwave transistor
Escher's art, Smith chart, and hyperbolic geometry
A spherical representation of the Smith chart
Microwave meta‐absorber by using Smith Chart
Design of metasurface-based polarization modulators by using Smith chart method
Smith chart for lossy transmission lines
Smith chart approach to the design of multilayer resistive sheet
🆕 Influential since 2022
Smith chart analysis for transmission line method validation of a simple graphene-based absorber in sugar molecules detection
Physical insight into the terahertz polarization modulator by using Smith chart
Impedance matching via ultrathin metatronic layer assisted by Smith Chart
Reinterpreting the Smith Chart Using Conformal Geometric Algebra
Automatic Procedure and the Use of the Smith Chart in Impedance Matching in Analog Circuits
📚 Books worth reading
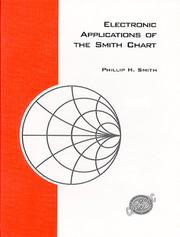 Electronic applications of the Smith ChartSmith, Phillip H. · 1969
 High-frequency amplifiersRalph S. Carson · 1975
- 📕Electronic applications of the Smith chartPhillip Hagar Smith · 1969
- 📕Théorie des lignesMarc Davio · 1967
- 📕Control system analysis and design using the Smith chartMatthew Laban Luhanga · 1990
 The Holtzman inkblot techniqueEvelyn F. Hill · 1972
 A practical introduction to impedance matchingThomas, Robert L. · 1976
 Microwaves made simpleSalvatore J. Algeri · 1986
Ranked by number of editions on Open Library, a rough measure of how lasting a book is.
🔗 Related topics
- Transmission line In electrical engineering, a transmission line is a specialized cable or other structure designed to conduct electromagnetic waves in a contained manner…
- Reflection coefficient In physics and electrical engineering the reflection coefficient is a parameter that describes how much of a wave is reflected by an impedance discontinuity…
- Characteristic impedance The characteristic impedance or surge impedance (usually written Z0) of a uniform transmission line is the ratio of the amplitudes of voltage and current…
- Quarter-wave impedance transformer A quarter-wave impedance transformer, often written as λ/4 impedance transformer, is a transmission line or waveguide used in electrical engineering of…
- Impedance matching In electrical engineering, impedance matching is the practice of designing or adjusting the input impedance or output impedance of an electrical device…
- Standing wave ratio In radio engineering and telecommunications, standing wave ratio (SWR) is a measure of impedance matching of loads to the characteristic impedance of a…
- Primary line constants The primary line constants are parameters that describe the characteristics of conductive transmission lines, such as pairs of copper wires, in terms of…
- Stub (electronics) In microwave and radio-frequency engineering, a stub or resonant stub is a transmission line or waveguide connected at one end only. The free end of the…