Live briefing
Everything about Memory debugger
Software memory problem finder
A memory debugger is a debugger for finding software memory problems such as memory leaks and buffer overflows. These are due to bugs related to the allocation and deallocation of dynamic memory. Programs written in languages that have garbage collection, such as managed code, might also need memory debuggers, e.g. for memory leaks due to "living" references in collections. Wikipedia →
🧭 Start here: a 6-step reading path
- Read the overview: Memory debuggerA 5-minute orientation
- Pick up a classic book: Debugging Macintosh software with MacsBugThe most-reprinted book on the subject
- Go sideways: Dynamic program analysisA closely related topic
- Go sideways: Memory safetyA closely related topic
📖 Definitions
No dictionary entry for this exact phrase.
🗂️ The subject at a glance
🏆 Landmark papers (most cited)
- No matching papers found.
📚 Books worth reading
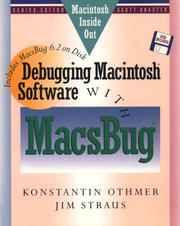 Debugging Macintosh software with MacsBugKonstantin Othmer · 1991
Ranked by number of editions on Open Library, a rough measure of how lasting a book is.
🔗 Related topics
- Dynamic program analysis Dynamic program analysis is the act of analyzing software that involves executing a program – as opposed to static program analysis, which does not execute…
- Memory safety Memory safety is the state of being protected from various software bugs and security vulnerabilities when dealing with memory access, such as buffer overflows…
- Programming tool A programming tool or software development tool is a computer program that is used to develop another computer program, usually by helping the developer…
- Execution (computing) In computing, execution is a process by which a computer program is read by a computer and the computer performs the actions encoded in the program. As…
- Cppcheck Cppcheck is a static code analysis tool for the C and C++ programming languages. It is a versatile tool that can check non-standard code. The creator and…
- Dynamic testing In software development, dynamic testing (or dynamic analysis) is examining the runtime response from a software system to particular input (test case)…
- Program analysis In computer science, program analysis is the process of analyzing the behavior of computer programs regarding a property such as correctness, robustness…
- Intel Inspector Intel Inspector (previously known as Intel Thread Checker) is a memory and thread checking and debugging tool by Intel to increase the reliability, security…