Live briefing

Everything about Matplotlib
Library for creating visualizations in Python
Matplotlib is a plotting library for the Python programming language and its numerical mathematics extension NumPy. It provides an object-oriented API for embedding plots into applications using general-purpose GUI toolkits like Tkinter, wxPython, Qt, or GTK. There is also a procedural "pylab" interface based on a state machine, designed to closely resemble that of MATLAB, though its use is discouraged. SciPy makes use of Matplotlib. Wikipedia →
🧭 Start here: a 6-step reading path
- Read the overview: MatplotlibA 5-minute orientation
- Skim a recent paper: mpl-interactions: A Python Package for Interactive Matplotlib FiguresInfluential work since 2022
- Pick up a classic book: Data science from scratchThe most-reprinted book on the subject
- Read the landmark paper: Matplotlib: A 2D Graphics EnvironmentCited 38,121 times
- Go sideways: NumPyA closely related topic
- Go sideways: IPythonA closely related topic
📖 Definitions
No dictionary entry for this exact phrase.
🗂️ The subject at a glance
🏆 Landmark papers (most cited)
Matplotlib: A 2D Graphics Environment
AIMBAT: A Python/Matplotlib Tool for Measuring Teleseismic Arrival Times
Comparative Analysis of Data Visualization Libraries Matplotlib and Seaborn in Python
Windrose: A Python Matplotlib, Numpy library to manage wind and pollution data, draw windrose
[Fundamentals] 4. Visualization in Python Programming: How to Use Matplotlib and seaborn
AvoPlot: An extensible scientific plotting tool based on matplotlib
MatplotAlt: A Python Library for Adding Alt Text to Matplotlib Figures in Computational Notebooks
Visualizing data using Matplotlib and Seaborn libraries in Python for data science
🆕 Influential since 2022
mpl-interactions: A Python Package for Interactive Matplotlib Figures
Desenvolvendo Ferramentas para Ensino de RISC-V com Python, Verilog, Matplotlib, SVG e ChatGPT
DATA ANALYSIS IN PYTHON USING PANDAS AND MATPLOTLIB
USING THE POTENTIAL OF THE MATPLOTLIB LIBRARY FOR DATA VISUALIZATION IN THE WORK OF ENGINEERS AND RESEARCHERS
Penerapan Matplotlib dalam Visualisasi Data untuk Analisis Hubungan Penggunaan Gadget dan Hasil Belajar
📚 Books worth reading
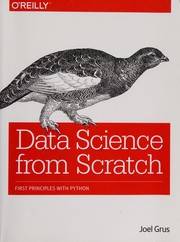 Data science from scratchJoel Grus · 2015
 Python Data AnalyticsFabio Nelli · 2015
- 📕Python Data Cleaning CookbookMichael Walker · 2020
 NumPy CookbookIvan Idris · 2012
 Pythonで学ぶディープラーニングの理論と実装 · 2016
 Mastering matplotlibDuncan M. McGreggor · 2015
- 📕Gráficos en Python con MatplotlibAlberto Cuevas Álvarez · 2020
- 📕matplotlib Plotting CookbookAlexandre Devert · 2014
Ranked by number of editions on Open Library, a rough measure of how lasting a book is.
🔗 Related topics
- NumPy NumPy (pronounced /ˈnʌmpaɪ/ NUM-py) is a library for the Python programming language, adding support for large, multi-dimensional arrays and matrices,…
- IPython IPython (Interactive Python) is a command shell for interactive computing in multiple programming languages, originally developed for the Python programming…
- Plotly Plotly is a technical computing company headquartered in Montreal, Quebec, that develops online data analytics and visualization tools. Plotly provides…
- SciPy SciPy (pronounced /ˈsaɪpaɪ/ "sigh pie") is a free and open-source Python library used for scientific computing and technical computing. SciPy contains…
- John D. Hunter John D. Hunter (August 1, 1968 – August 28, 2012) was an American neurobiologist and the original author of Matplotlib. Hunter was brought up in Dyersburg…
- List of Python software The Python programming language is actively used by many people, both in industry and academia, for a wide variety of purposes. Atom — an open-source cross-plat…
- Spyder (software) Spyder is an open-source cross-platform integrated development environment (IDE) for scientific programming in the Python language. Spyder integrates with…
- Enthought Enthought, Inc. is a software company based in Austin, Texas that develops scientific and analytic computing for R&D. It is known for the early development…