Everything about Descriptive statistics
Type of statistics
A descriptive statistic is a summary statistic that quantitatively describes or summarizes features from a collection of information, while descriptive statistics is the process of using and analysing those statistics. Descriptive statistics is distinguished from inferential statistics by its aim to summarize a sample, rather than use the data to learn about the population that the sample of data is thought to represent. This generally means that descriptive statistics, unlike inferential statistics, is not developed on the basis of probability theory, and are frequently nonparametric statistics. Even when a data analysis draws its main conclusions using inferential statistics, descriptive statistics are generally also presented. For example, in papers reporting on human subjects, typically a table is included giving the overall sample size, sample sizes in important subgroups, and demographic or clinical characteristics such as the average age, the proportion of subjects of each sex, the proportion of subjects with related co-morbidities, etc. Wikipedia →
🧭 Start here: a 6-step reading path
- Read the overview: Descriptive statisticsA 5-minute orientation
- Skim a recent paper: Quality Analysis of Photovoltaic System Using Descriptive Statistics of Power Performance IndexInfluential work since 2022
- Pick up a classic book: The Return of the NativeThe most-reprinted book on the subject
- Read the landmark paper: Descriptive statistics for multivariate distributionsCited 355 times
- Go sideways: Univariate (statistics)A closely related topic
- Go sideways: Summary statisticsA closely related topic
📖 Definitions
Noun A branch of statistics dealing with summarization and description of collections of data—data sets, including the concepts of arithmetic mean, median, mode, and quantile.
🗂️ The subject at a glance
🏆 Landmark papers (most cited)
Descriptive statistics for multivariate distributions
Descriptive statistics
Understanding descriptive statistics
Descriptive Statistics and Graphical Displays
Descriptive Statistics and Its Applications
Descriptive Statistics
Descriptive statistics
Descriptive Statistics, Part II: Most Commonly Used Descriptive Statistics
🆕 Influential since 2022
Quality Analysis of Photovoltaic System Using Descriptive Statistics of Power Performance Index
Teaching Descriptive Statistics and Hypothesis Tests Measuring Water Density
Descriptive Statistics, An Important First Step
Complexity of Molecular Nets: Topological Approach and Descriptive Statistics
How to Conduct Descriptive Statistics Online
📚 Books worth reading
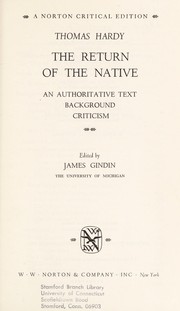 The Return of the NativeThomas Hardy · 1878
 Essai politique sur le royaume de la Nouvelle-EspagneAlexander von Humboldt · 1811
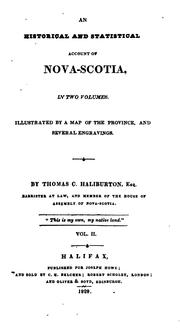 An historical and statistical account of Nova-ScotiaThomas Chandler Haliburton · 1826
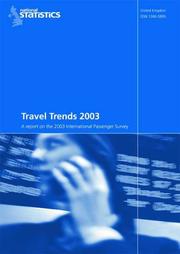 Travel TrendsOffice for National Statistics · 1996
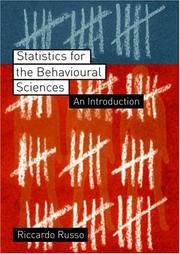 Statistics for the behavioural sciencesRiccardo Russo · 2003
 Gazetteer of the State of New YorkJ. H. French · 1860
 Statistical account of Upper CanadaRobert Gourlay · 1822
 Historisch-statistisches Gemälde des Russischen Reichs am Ende des achtzehnten JahrhundertsHeinrich Friedrich von Storch · 1797
Ranked by number of editions on Open Library, a rough measure of how lasting a book is.
🔗 Related topics
- Univariate (statistics) Univariate is a term commonly used in statistics to describe a type of data which consists of observations on only a single characteristic or attribute…
- Summary statistics In descriptive statistics, summary statistics are used to summarize a set of observations, in order to communicate the largest amount of information as…
- Bivariate analysis Bivariate analysis is one of the simplest forms of quantitative (statistical) analysis. It involves the analysis of two variables (often denoted as X, Y)…
- Mathematical statistics Mathematical statistics is the application of probability theory and other mathematical concepts to statistics, as opposed to techniques for collecting…
- Normality test In statistics, normality tests are used to determine if a data set is well-modeled by a normal distribution and to compute how likely it is for a random…
- Shape of a probability distribution In statistics, the concept of the shape of a probability distribution arises in questions of finding an appropriate distribution to use to model the statistical…
- Glossary of probability and statistics These terms and concepts are used in the mathematical sciences of statistics and probability, their sub-disciplines, and related fields. For additional…
- Frequency (statistics) In statistics, the frequency or absolute frequency of an event i is the number ni of times the observation has occurred or been recorded in an experiment…