Live briefing

Everything about Control chart
Tool to assess control of a manufacturing process
Control charts are graphical plots used in statistical process control (SPC) to determine whether a manufacturing or business process is in a state of statistical control. They form the basis of modern statistical process control, and are one of the seven basic tools of quality control. Wikipedia →
🧭 Start here: a 6-step reading path
- Read the overview: Control chartA 5-minute orientation
- Skim a recent paper: Design of a new adaptive EWMA control chartInfluential work since 2022
- Pick up a classic book: Cumulative sum charts and charting for quality improvementThe most-reprinted book on the subject
- Read the landmark paper: The Regression Control ChartCited 165 times
- Go sideways: Statistical process controlA closely related topic
- Go sideways: Walter A. ShewhartA closely related topic
📖 Definitions
Noun A tool used to determine whether a manufacturing or business process is in a state of statistical control or not.
🏆 Landmark papers (most cited)
The Regression Control Chart
Feature-based control chart pattern recognition
Multivariate Bayesian Control Chart
A Dispersion Control Chart
Multivariate binomial/multinomial control chart
A process variability control chart
Tukeyʼs Control Chart
Poisson DEWMA Control Chart
🆕 Influential since 2022
📚 Books worth reading
 Cumulative sum charts and charting for quality improvementDouglas M. Hawkins · 1998
- 📕The Basics of process mappingRobert Damelio · 2010
- 📕Advanced topics in statistical process controlDonald J. Wheeler · 1995
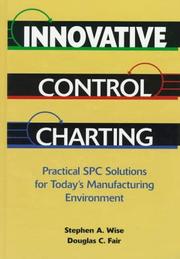 Innovative control chartingStephen A. Wise, Douglas C. Fair · 1997
 IEC 61499 function blocks for embedded and distributed control systems designValeriy Vyatkin · 2007
- 📕Thesaurus en automatisme et régulationEmile Peeters · 1972
 Nurse's guide to infection control practiceE. Jacquelyn Kirkis · 1988
 Planning for a familyJohn Marshall · 1965
Ranked by number of editions on Open Library, a rough measure of how lasting a book is.
🔗 Related topics
- Statistical process control Statistical process control (SPC) or statistical quality control (SQC) is the application of statistical methods to monitor and control the quality of…
- Walter A. Shewhart Walter Andrew Shewhart (pronounced like "shoe-heart"; March 18, 1891 – March 11, 1967) was an American physicist, engineer and statistician. He is sometimes…
- Common cause and special cause (statistics) Common and special causes are the two distinct origins of variation in a process, as defined in the statistical thinking and methods of Walter A. Shewhart…
- Shewhart individuals control chart In statistical quality control, the individual/moving-range chart is a type of control chart used to monitor variables data from a business or industrial…
- Process capability The process capability is a measurable property of a process to the specification, expressed as a process capability index (e.g., Cpk or Cpm) or as a process…
- Natural process variation Natural process variation, sometimes just called process variation, is the statistical description of natural fluctuations in process outputs. The following…
- W. Edwards Deming William Edwards Deming (October 14, 1900 – December 20, 1993) was an American business theorist, composer, economist, industrial engineer, management consultant…
- X̅ and R chart In statistical process control (SPC), the x¯ and R chart, also known as an averages and range chart, is a type of scheme, popularly known as control chart…